Boundary Maps: the Oct 23, 2026 Draft
Interactive maps of the District’s Oct 23, 2026 boundary draft, which closes Dewey and Lincolnwood. They use the District’s own lines and its Oct 28, 2026 counts of students who change school.
Legion of Data Nerds
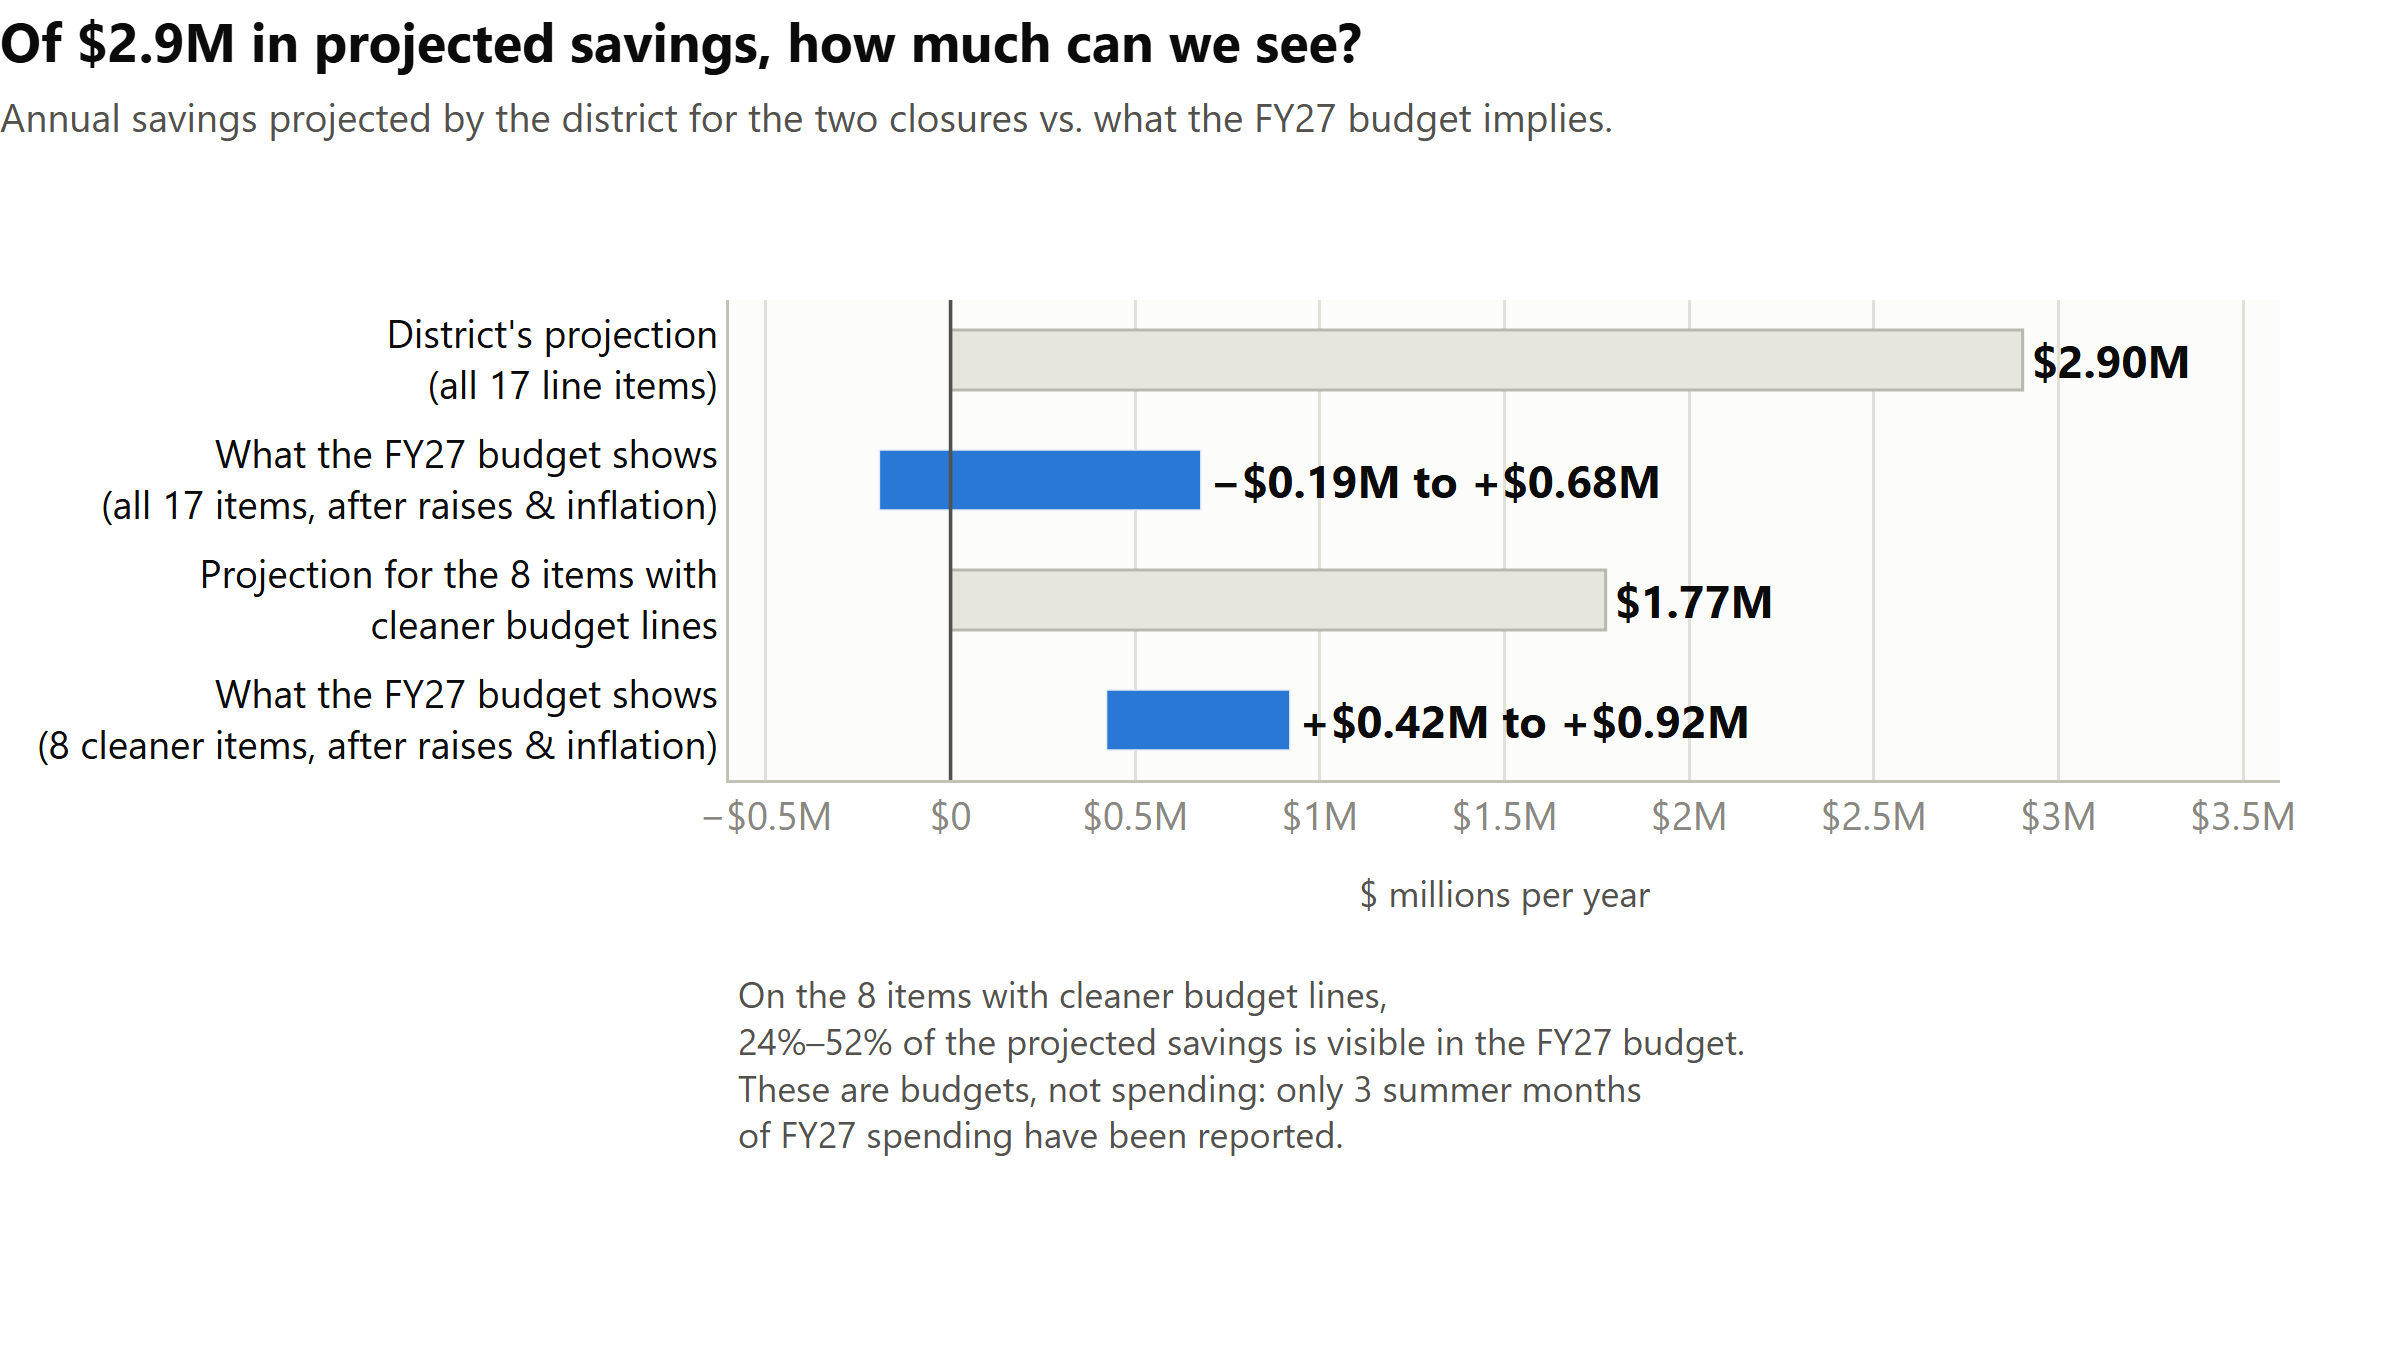
The District projected about $2.9M a year in savings from closing the two schools. Tracking those 17 budget lines in the monthly Treasurer’s reports, only part of it shows up in the FY27 budget so far.
a year in savings the District credits to closing Kingsley and Bessie Rhodes.
Read the analysis →of the projected closure savings is visible in the FY27 budget so far, on the 8 budget lines clean enough to read.
Read the analysis →K-5 classroom teachers this year, exactly the same as last year, with two fewer schools.
Read the analysis →rise in administrative spending per student, after inflation, between FY16 and FY25.
Read the analysis →Interactive maps of the District’s Oct 23, 2026 boundary draft, which closes Dewey and Lincolnwood. They use the District’s own lines and its Oct 28, 2026 counts of students who change school.
The District credited the two closures with $3.0M a year in savings and proposed closing Lincolnwood and Dewey on the same basis. On the SY2026-27 staffing data so far, the realized staffing savings appear to be a fraction of the $2.0M stated.
High-utilization buildings don’t have bigger classes, the smallest classes are at the dual-language schools, and one closure nets roughly $0.2–0.7M a year after busing.
Questions to bring to the District’s Sept. 22–24 sessions on its plan to cut $20M and close at least two schools.
A recap of what we learned analyzing SDRP Phase III data and methods, with a request to meet on data, methodology and process.
How District 65’s central office doubled while enrollment fell 24%, what the SDRP cut, and what right-sizing the sub-cabinet would save.
An interactive look at how D65 spends its Educational Fund, FY2012–FY2026: spending by category as a share of the budget, in dollars or per pupil, with peer districts to compare.

How administrators are counted, which data sources we use, and what the numbers mean.